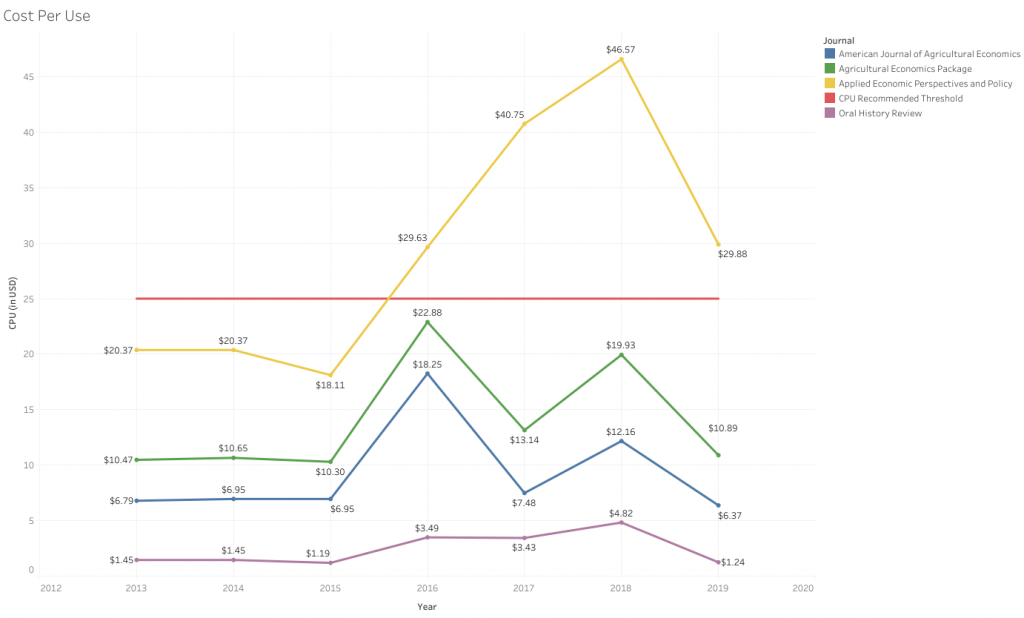
One of the challenges that every library from small, local public libraries to the academic libraries of large research universities face is how to spend their budget in a way that serves the most patrons. University of North Texas (UNT) Libraries are no exception to this struggle. The current purchasing budget at UNT Libraries sits around seven million dollars, and while this leaves a lot of freedom, that freedom can also present a challenge (UNT Libraries, 2020.) How can we as librarians make sure that the books, databases, and journals that we spend money on are really serving you, our patrons, with your learning, teaching, and research needs? We generally evaluate these resources in three ways: through analyzing individual resources like in the graph above, through our annual serials review, and through evaluations of entire subjects.
Many of the purchases of smaller items like individual books come from recommendations by our patrons and the liaison librarians they work with. This works well on a small scale, but it is possible that we are either buying too much of one subject or too little of another subject. One of the ways we try to avoid this is through periodic evaluations. Every year about five or six subjects are chosen on a rotating basis to be evaluated. This means that a subject is assessed every ten years. The assessment starts with looking into things like what classes are required for that major, the number of students majoring in that program, the research interests of faculty, and recent dissertations. Once we know these things, we can consider what students, faculty, and staff working in that subject area need. These needs are then compared against what we already have. We can also check on the quality of what we have by using comparing what we have against the Choice’s Outstanding Academic Titles (OAT) lists for books and looking at the rankings of journals we offer in the Journal Citation Reports (JCR). Finally, the information about how often resources like books, journals, and databases is collected in order to gauge how well what we have in that subject area is used. These pieces of information are compiled into a report detailing the strengths and weakness of that what we offer for that subject. After creating this report, it can be reviewed by both librarians and a departmental representative so that we can earmark money for making improvements over the course of the next year.

Oxford Specific Journal Use Analysis 2020 by the author licensed under University of North Texas Libraries Collection Assessment
More in-depth and individual evaluations are often needed on a case-by-case basis. This is done for a variety of reasons. Sometimes, the price of a specific resource is up for negotiation and the librarians negotiating want to know more about the resource and its value. This sort of analysis is also done when new resources are being considered. Instead of trusting that a recommended resource will be well-used, similar journals or databases can be considered to see how well-used they are and how the proposed resource might fit into what we offer. One of the main ways that we can measure the value of a resource is through a simple cost per use calculation. The graph shown in the header is an example of a cost per use calculation where the usage for that resource was collected from our databases along with the costs for each specific resource. The annual cost was then divided by the usage for that year. We look at this cost per use calculation as well as trends in the usage so that we can make a recommendation based on evidence.
Here at UNT Libraries, we are working hard to develop better ways to assess and enhance our collections using evidence to make decisions. You too can have an influence on our collections here at UNT Libraries. If there is a book, journal, or resource that you think we should purchase but currently do not have, you can suggest purchases here, or you can e-mail us at askus@unt.edu about any questions you might have. We really value your input when making decisions, and we enjoy helping you find what you need to be successful here at UNT. Also, if you want to see more visualizations of our collections data and recent evaluations from our Collection Assessment department, feel free to visit our Tableau profile. Many of the visualizations there are updated regularly with monthly usage data. What do you think?
Please leave a comment below.
1 Do you like theatre? You should check out Digital Theatre+ for a lot of recorded theatre productions as well as behind the scenes information. We also subscribe to Naxos which has a wide variety of music from pop to jazz to classical.
2 Primal Pictures Anatomy has 3D interactive models of human anatomy and learning modules for Speech Language Pathology and Audiology topics.
3 Check out Sports Market Analytics for extensive sports data or Morningstar for economics data that is updated daily.
References:
UNT Libraries. (2020). Updated Report 2020. Collection Assessment. Denton: University of North Texas Libraries. Retrieved January 13, 2020


Kathryn Gould Cullivan
Fascinating information – I had no idea how this was done