

…that you can see usage statistics for items, collections, and contributing partners/departments in the digital collections?
We have statistics available to see how often items are being used at several granularities (e.g., by partner, collection, or item). At each level, there is a link or tab to view “Statistics.”
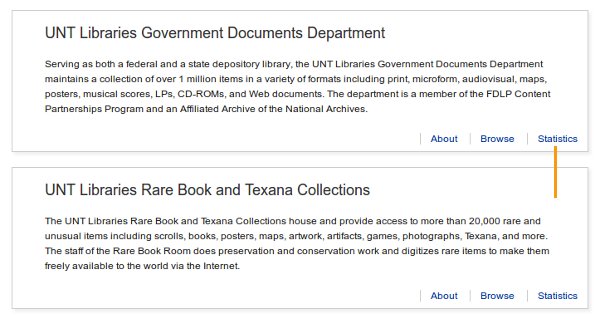
For example, if you “Explore” our list of Partners or Collections, you can choose “Statistics” in the results list:
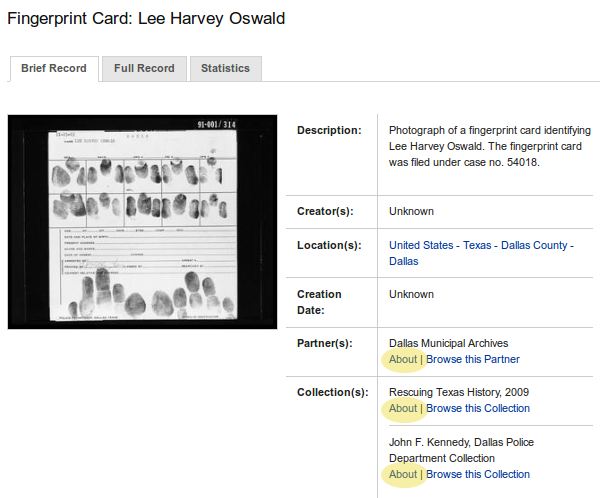
You might also be curious about the collection or partner and visit the “About” page, either from the link on the explore page (above), or on an item record:
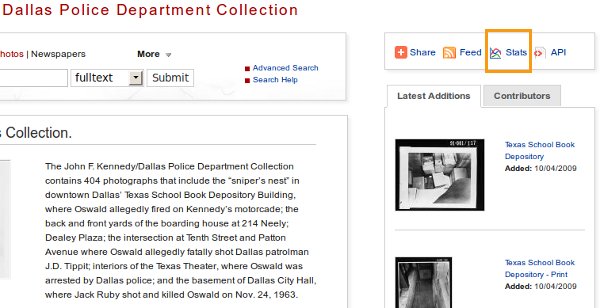
From the “About” page, you can still see the statistics for the collection or partner by clicking on the “Stats” button in the upper-right corner:
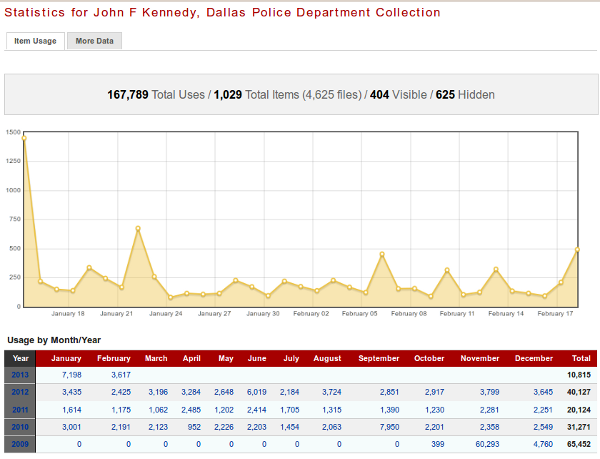
The statistics show the number of items, the number of files, the total monthly usage for the collection or items contributed by the partner, and a graph of item usage for the last month.
You can also see usage statistics for indvidual items by looking at the bottom of the Brief Record or clicking on the “Statistics” tab while you’re looking at an item:
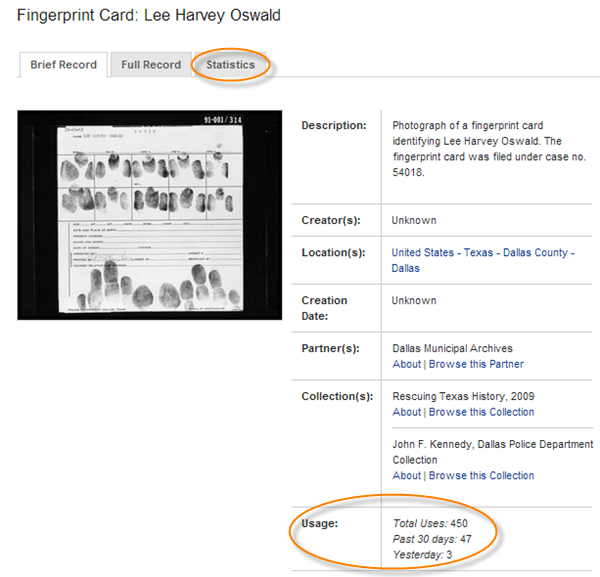
You may be surprised to see which collections or items are popular!

Leave a Reply