 What is it?
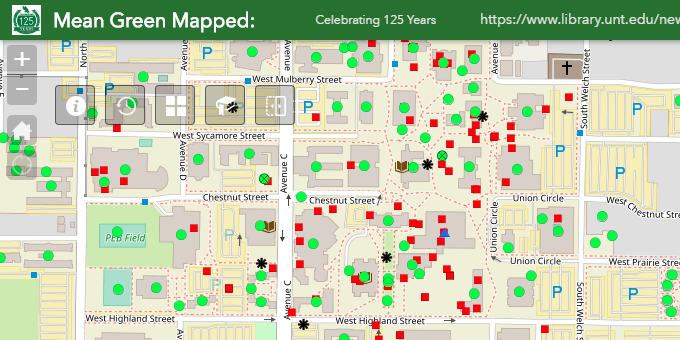
Mean Green Mapped is an interactive web map utilizing GIS software to illustrate UNT’s history through photographs and other media. It began with the goal of providing an opportunity for students, faculty, and members of the Denton community to interact with the history of campus by showing changes in the landscape and architecture from the 1900s to the present.
Work began in May 2015 after the project team was awarded the Dean’s Innovation Grant and continued until August 2016. The premise behind mapping the history of UNT’s campus comes from the idea that maps can display complex patterns, trends, and relationships across time quickly and easily.
What you’d need to know
When building any digital project, it is crucial to have the right tools at your disposal. Mean Green Mapped was created using the following platforms:
What is it?
Mean Green Mapped is an interactive web map utilizing GIS software to illustrate UNT’s history through photographs and other media. It began with the goal of providing an opportunity for students, faculty, and members of the Denton community to interact with the history of campus by showing changes in the landscape and architecture from the 1900s to the present.
Work began in May 2015 after the project team was awarded the Dean’s Innovation Grant and continued until August 2016. The premise behind mapping the history of UNT’s campus comes from the idea that maps can display complex patterns, trends, and relationships across time quickly and easily.
What you’d need to know
When building any digital project, it is crucial to have the right tools at your disposal. Mean Green Mapped was created using the following platforms:
- ArcGIS Online Platform is a cloud-based mapping platform that connects people with maps, data, and apps through geographic information systems (GIS).
- ArcMap 10.3 is used to create maps, perform spatial analysis, manage geographic data, and share the results.
- ArcGIS for Server 10.3 is software that makes geographic information available to anyone with an Internet connection.
- GlobalMapper 16.2 uses GIS to offer access to a variety of spatial datasets.
Get Started
ArcGIS Platform: http://www.esri.com/
QGIS: http://www.qgis.org/en/site/
Pleiades: http://pleiades.stoa.org/
For questions about getting started, contact GIS Librarian Douglas Burns (Douglas.Burns2@unt.edu).
Resources:
http://www.library.unt.edu/news/eagle-commons-library/mean-green-mapped
http://desktop.arcgis.com/en/arcmap/
http://www.esri.com/software/arcgis/arcgisonline
http://server.arcgis.com/en/server/10.3/get-started/windows/what-is-arcgis-for-server-.htm
http://www.bluemarblegeo.com/products/global-mapper.php
Inspired by Miriam Posner’s famous “How did they make that?” post.


Leave a Reply