

 Author: Maristella Feustle Many of us have been doing basic visualizations of quantitative data since elementary school, turning numerical information into charts and graphs. Somewhere along the line, most of us have also encountered Venn diagrams for visualizing conceptual relationships and attributes held in common between entities. But when we think of visualization, quantitative visualizations… Read more »
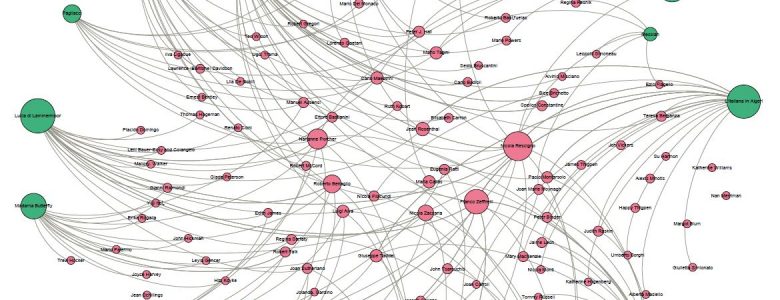
Using Gephi for Data Visualization
Author: Maristella Feustle Many of us have been doing basic visualizations of quantitative data since elementary school, turning numerical information into charts and graphs. Somewhere along the line, most of us have also encountered Venn diagrams for visualizing conceptual relationships and attributes held in common between entities. But when we think of visualization, quantitative visualizations… Read more »