

Author: Maristella Feustle
Many of us have been doing basic visualizations of quantitative data since elementary school, turning numerical information into charts and graphs. Somewhere along the line, most of us have also encountered Venn diagrams for visualizing conceptual relationships and attributes held in common between entities. But when we think of visualization, quantitative visualizations such as those produced by Excel are more accessible.
Of course, not all data is quantitative. Not all data points are numbers, and not all of the relationships between them are numerical, and yet we intuitively understand that context can be as complex as it is important. That is where Gephi comes in. If you can articulate a relationship, you can map it.
Gephi depends on the “triple” relationship that also underlies RDF, the Resource Description Framework metadata model, of clear interest to library and information science. In the triple, Something has a connection with something else. Or, Person 1 is somehow connected to Person 2. Attribute 1 is somehow connected to Attribute 2.
The attributes are nodes, and the connection, whatever it is, is an edge. Two nodes plus one edge are three things, or a triple. Connections may be reciprocal, or only one direction.
Potential examples are virtually limitless: Say, for example, that Jeremiah was a bullfrog. That is, Jeremiah has the attribute of being a bullfrog. Jeremiah and bullfrog-ness (to coin a term) are nodes. Having the attribute is an edge. Jeremiah was also a good friend of mine. That is, Jeremiah was member of the set of good friends of mine.
Those are just a few connections. What about when your connections have connections? We need a more sophisticated way to keep track of them.
This demonstration uses data from lists of operas and performers in the appendix to Ronald Davis’ La Scala West: The Dallas Opera under Kelly and Rescigno, tracing roughly the first ten years of productions by the Dallas Opera.
Using a Comma Separated Value (CSV file), we’ve articulated people and the roles they played respectively as the two required columns for Gephi to import as an edge table: Source and Target.
Here, it is worth noting that Gephi can be very picky about how your data is formed. In order to avoid the creation of spurious nodes and connections, it is important to be sure your data is clear of extra spaces and characters that could, for example, cause Gephi to decide that Maria [space] Callas and Maria [space space] Callas are two different people. When you have hundreds or thousands of nodes and connections, unnecessary distinctions like those can really throw your visualization. For preparing data, OpenRefine is a very useful companion to Gephi.
Even with a well-constructed dataset, Gephi’s initial visualization output looks like throwing spaghetti and meatballs at the wall, only more angular:
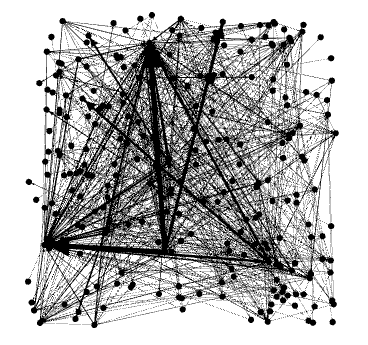
The important distinction to note here is that Gephi does the math for you, but does not make decisions for you. Therefore, the choice of how to apply colors to differentiate types of nodes and edges, or degrees of connectivity, and which algorithms best represent the meaning you want your visualization to demonstrate, what to label, and so on, are up to you. These features are tightly packed into Gephi’s user interface, and experimenting with them is part of the fun of the program. Further options reside in the plug-ins that come bundled with the program.
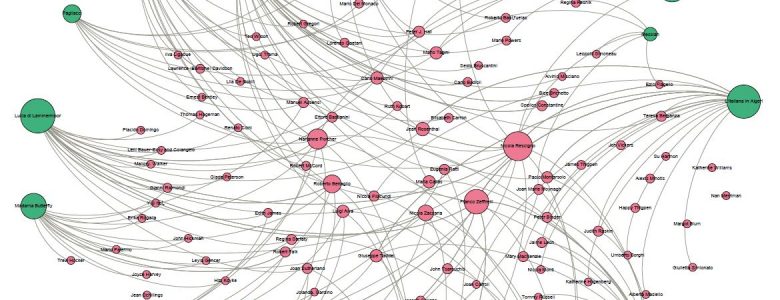
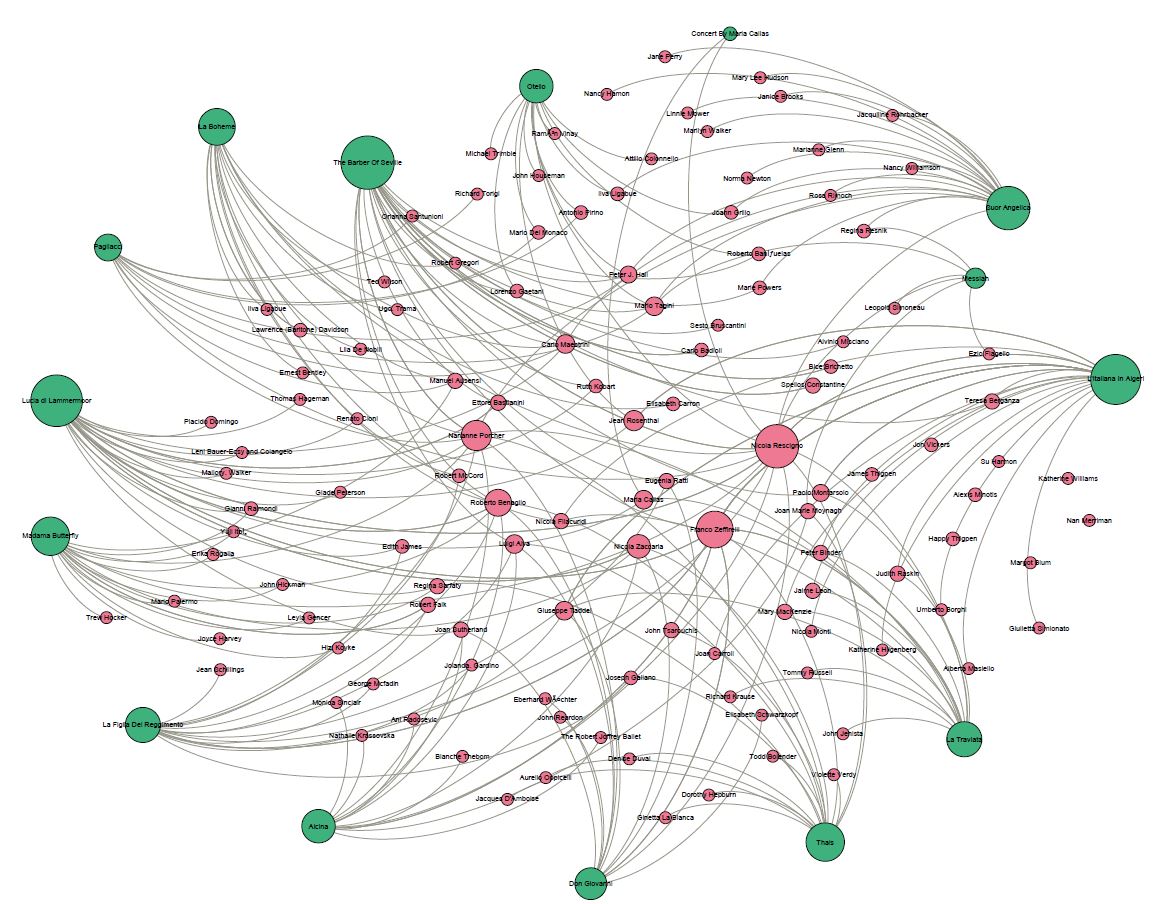
In this case, the end result allowed us to show in a single image the intricacies of the connections between performers in the Dallas Opera, as well as the major artists, frequent performers, and frequent productions in the early years of the Dallas Opera — in short, a map of relationships between performers, works, and one another.
To get started with Gephi, please visit the links below:
https://gephi.org/tutorials/gephi-tutorial-quick_start.pdf (Refers to an old version, but still useful)
http://www.martingrandjean.ch/gephi-introduction/
https://seinecle.github.io/gephi-tutorials/
Leave a Reply