A treemap is a space-filling visualization for displaying weighted hierarchical data using nested rectangles. The rectangles can be coded by color and size to show patterns that may be difficult to visualize in other ways. RAWGraphs give the user the option of incorporating as many colors into the visualization as they like, making it easy to represent several different categories from a set of data.
For this demonstration, I used a dataset of track listings from Now That’s What I Call Music (volumes 1- 61). The dataset included specs about each track, including the duration and ratings for danceability, speechiness, energy, tempo, and instrumentation. I thought it would be interesting to see how genres varied across the volumes, but I quickly realized displaying genre data for over sixty volumes would get out of hand. Instead, I did some research and looked up the genre of each song listed for volumes 1, 30, and 60, as I felt this would provide a fair representation of how the composition of the albums have changed across time. When multiple genres were listed for a song, I chose to use the first genre listed in the song description.
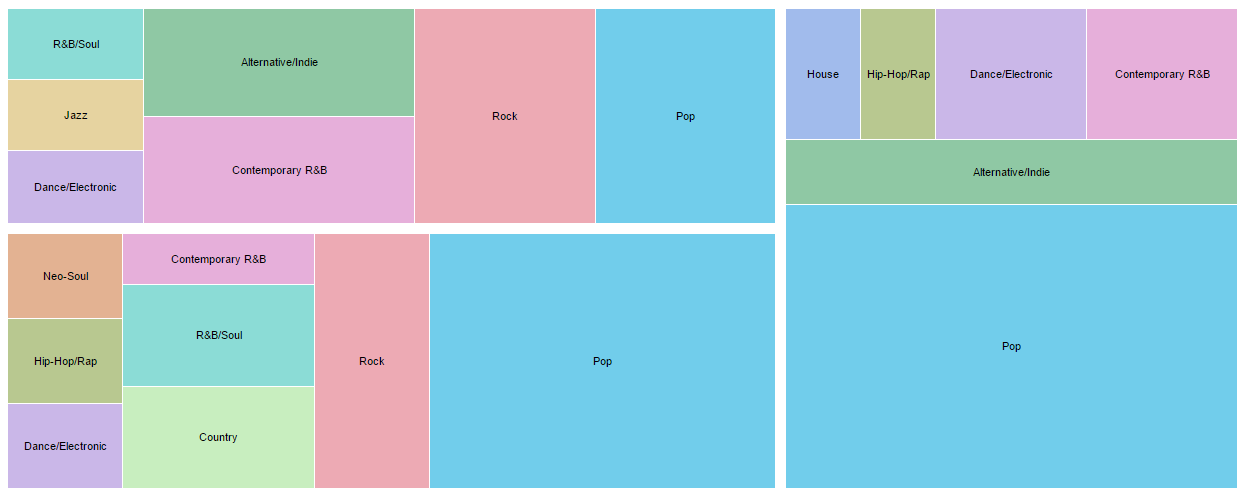
I pasted this data into RAW and used the treemap to display it. The section on the top left is volume 1, the one below it is volume 30, and the one to the right is volume 60. I found quickly (and unsurprisingly) that as more compilations have been released, there has been more of an emphasis on the pop genre, with volume 60 being almost exclusively pop. The treemap also shows that volume 30 had the most variability of the three sets I looked at. It may be interesting to look at the other volumes released around that time to see if there was a similar variability.
 For this visualization, I decided to play around with some color palette tools. I Want Hue is a free palette tool that automatically generates palettes of optimally distinct colors. The user can request as many colors in a palate as they need and the tool will generate colors and their codes. The treemap is one of the visualizations on RAWGraphs that allows you to enter color codes, so I copied and pasted the codes from I Want Hue over to RAW and voila!
Give it a try for yourself! http://tools.medialab.sciences-po.fr/iwanthue/
For this visualization, I decided to play around with some color palette tools. I Want Hue is a free palette tool that automatically generates palettes of optimally distinct colors. The user can request as many colors in a palate as they need and the tool will generate colors and their codes. The treemap is one of the visualizations on RAWGraphs that allows you to enter color codes, so I copied and pasted the codes from I Want Hue over to RAW and voila!
Give it a try for yourself! http://tools.medialab.sciences-po.fr/iwanthue/


Leave a Reply