A dendrogram is a tree diagram that is usually used for showing taxonomic relationships, but any data that lends itself to hierarchical data clustering can be displayed using a dendrogram. RAWGraphs offers two variations on dendrograms: the circular dendrogram and the cluster dendrogram. I had some fun playing around with different data sets to provide examples of these two visualizations.
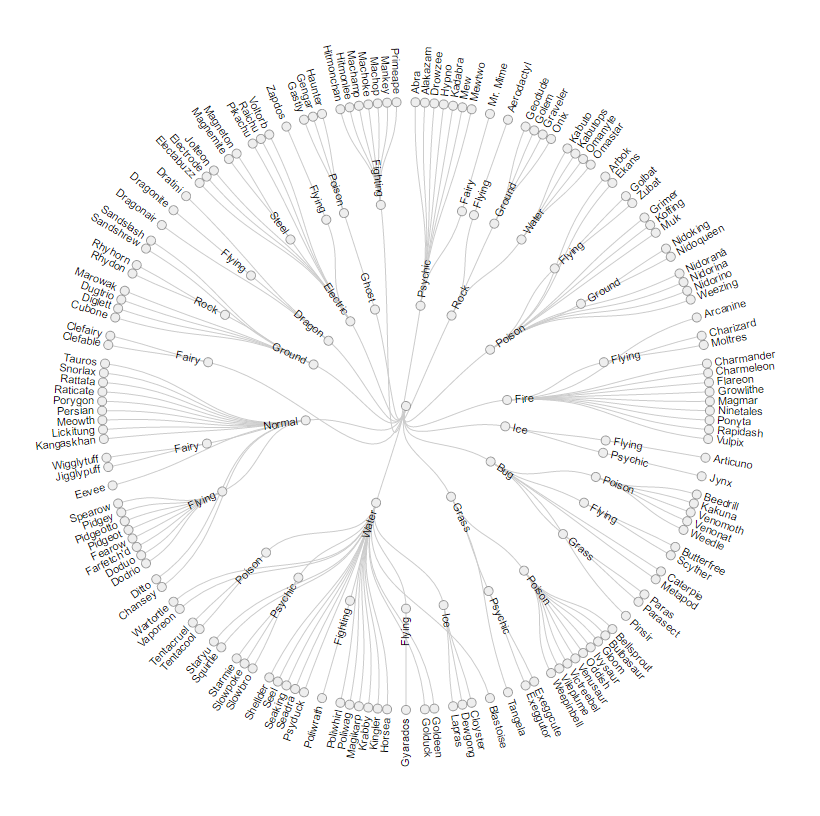
A circular, or radial cluster, dendrogram starts with more general classifications at the center and fans out to more specific classifications at the extremities. RAW give the user the option of using as many hierarchical steps as they want, and these can be in the form of strings, numbers, or dates.
I found a dataset from Kaggle that classified different Pokémon based on their type or types. I used the circular dendrogram to display this data, starting with their first type in the center and fanning out to their second type (if they had one) and then their name.
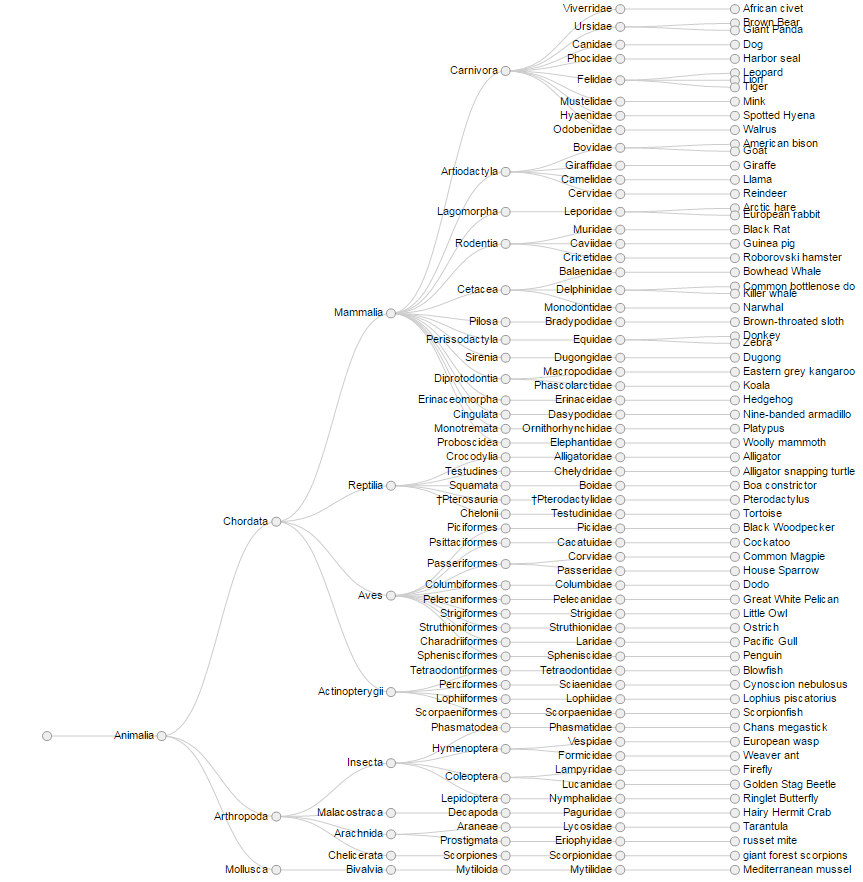
 The Pokémon dataset didn’t work very well as an example of the cluster dendrogram because it was too large. So to demonstrate the cluster dendrogram I used a sample dataset from RAWGraphs of taxonomic relationships in the animal kingdom. This dataset was more manageable in size so it was perfect for this visualization. The cluster dendrogram displays the hierarchical steps from left to right and sorts each element within the group vertically:
 These dendrograms don’t provide customization options like some of the other visualizations through RAW, but they do give the user a sleek, simple way to tell a story with their data. Datasets of all sizes can be displayed using one of the two variations offered, it’s up to you to decide!


Leave a Reply