 Researching statistics can be an intimidating task. Where do you begin looking for reliable data out of the vast number of sources available on the Internet and in the library? And what do you do with that data after you’ve found it? If you’re feeling overwhelmed, here is an excellent place to begin your statistical research.
Data-Planet Statistical Datasets is a powerful and versatile interactive research tool that provides quick, easy, one-stop access to a vast collection of statistical data collected by government agencies as well as by private entities. Statistics are available at the national, state, county, and local level. Some data are also available for other countries.
Not only do you have immediate access to billions of data points from over 70 source organizations; you can also manipulate that data to create custom charts, maps, graphs, and tables to compare data, describe trends over time, and represent data visually, all without the need for additional software programs. A citations feature even helps you easily cite your data in APA, MLA, or Chicago style.
Data-Planet Statistical Datasets is available to members of the UNT community (UNT students, faculty, and staff). Others may also access it from the public computers in the libraries on the UNT campus.
Find Your Data
There are several ways to find and select data in Statistical Datasets, depending on your particular needs and interests.
- You can search by keyword, using a simple search box at the top of the screen.
- You can browse by subject. Statistics are available in the following broad subject categories:
| Agriculture & Food | Industry, Business, & Commerce |
| Banking, Finance, & Insurance | Intrnational Relations & Trade |
| Criminal Justice & Law Enforcement | Labor & Employment |
| Education | Military & Defense |
| Energy Resources & Industries | Natural Resources & Environment |
| Government & Politics | Population & Income |
| Health & Vital Statistics | Prices, Consumption, & Cost of Living |
| Housing & Construction | Transportation & Traffic |
- You can browse by source. Statistics are available from dozens of U.S. government agencies, the United Nations, and several commercial and non-profit entities all over the world.
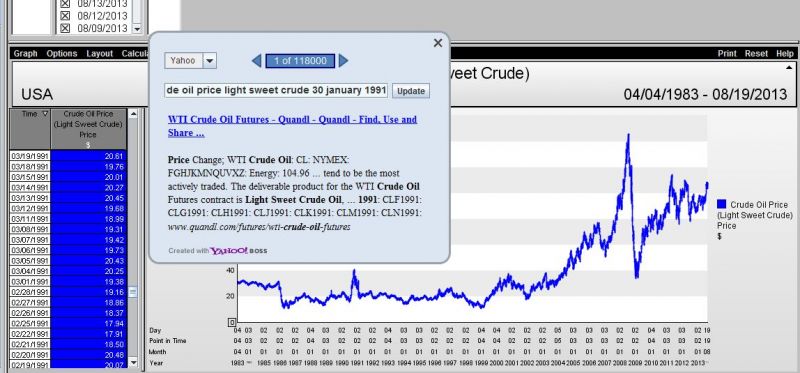
- An “In the News” feature provides quick access to statistics you’re most likely to hear about in the latest news stories: for instance, the national debt, gas prices, oil prices, and unemployment.
(By the way, if you want to find actual news stories about a particular statistic, double-click on any point in a trend chart and you’ll see a link to Internet news stories that discuss that statistic at that point in time—ingenious!)

- “Key Economic Indicators” provides direct access to data on inflation, exchange rates, housing startups, and other aspects of the U.S. economy.
Customize Your Data
After selecting the data, you can display and manipulate that data in a number of ways, either by selecting an icon at the top of the screen or by using the “Graph” option in the menu bar.
- Trends creates a graph that charts how a statistic has changed over a given time period.
- Ranking creates a table or chart to compare data.
- Map creates a map to show data for different geographic areas.
Once your data is displayed, you can alter the layout, refine the specific time periods and variables you want to display, or apply mathematical formulas to manipulate or analyze the data.
Export Your Data
Your custom data display can then be exported as a static image, delimited text, or dynamic spreadsheet. You can even save the data as a link that you paste into a document. When a reader clicks on the link, your beautiful, custom-made chart, table, or map opens up and displays the data.
Learn More
To learn more about Data-Planet Statistical Datasets, visit the Data-Planet Web site. Tutorials and training videos are available in the Statistical Datasets LibGuide. And, as always, please don’t hesitate to contact the UNT Government Documents Department if you need help with this database or have other research questions. With a little practice, this valuable resource can make your statistical research projects less stressful, more professional-looking, and perhaps even fun!


